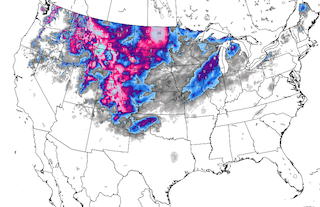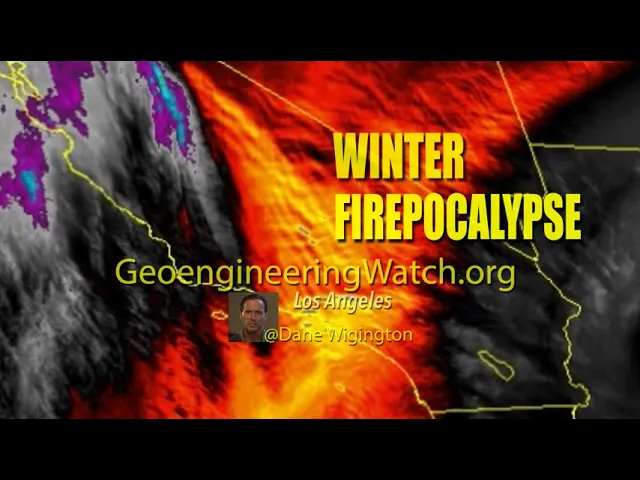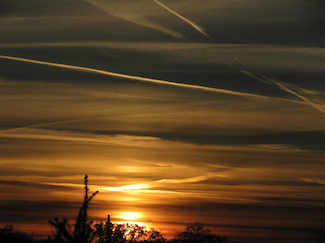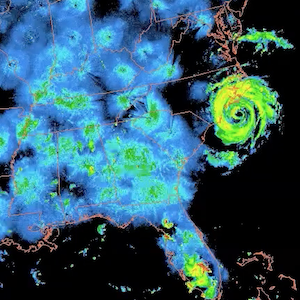


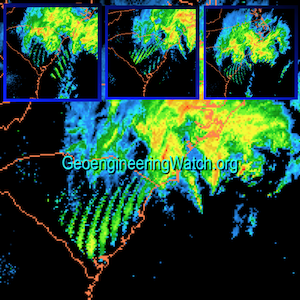


Chemically Nucleated Winter Weather


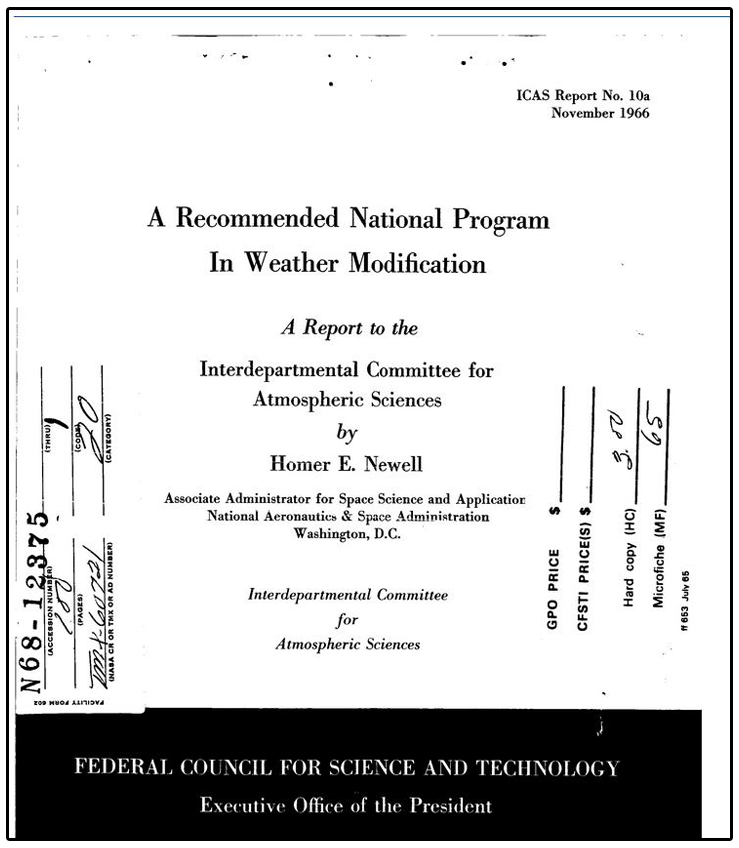
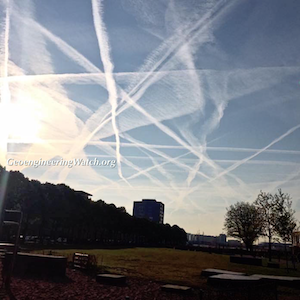
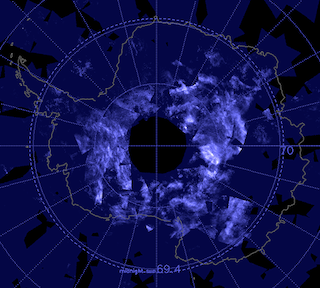
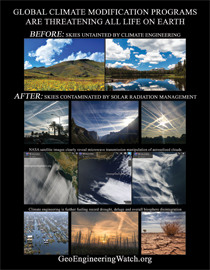
Dane Wigington GeoengineeringWatch.org The extremely anomalous surface cool-down in Texas and other parts of the world are not just random acts of Nature. Global climate engineering operations are not just a proposal, they have been an ongoing reality for over 70 years. Erratic and unprecedented weather is radically increasing everywhere. Though there are countless forms of human activity affecting the equation, the global […]