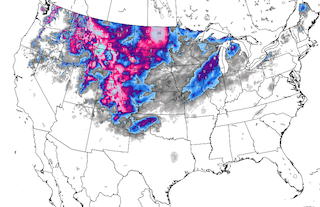
This is more a climate report than a weather report; yet, the extreme weather that did hit the U.K. recently and that is forecast to hit large parts of North America next week may make more people realize that action is needed now. So, please share!
At the moment, a large part of Russia is experiencing temperature anomalies at the highest end of the scale, i.e. more than 36°F (20°C) warmer than average past records.
Above image shows the situation as at March 20, 2014. Over the past year, average temperatures over the Arctic Ocean have been much higher than they used to be, as illustrated by the NOAA image below.
 |
| [ compare the temperature anomaly for the Arctic Ocean in above image with the anomaly for the year 2013 ] |
Temperatures over the Arctic Ocean are expected to rise even further next week. The Arctic as a whole is expected to reach average anomalies as high as 5.3°C next week, while many areas over the Arctic Ocean are expected to be hit by even higher anomalies, as the image below shows.
 |
| [ click on image to enlarge ] |
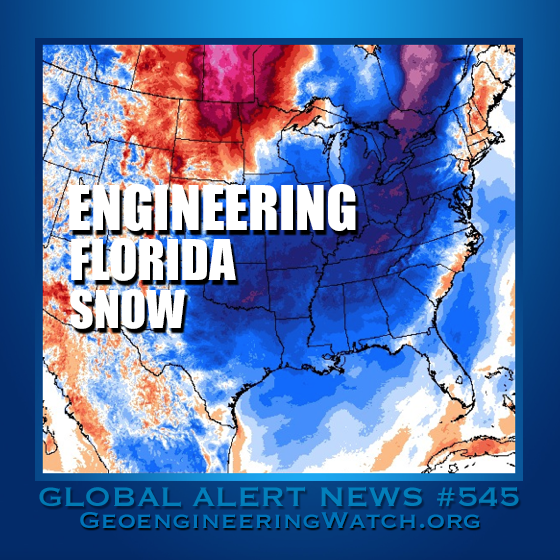
Above image also shows that, at the same time, very low temperatures – with anomalies at the low end of the scale – are expected to hit a large part of North America. The image below shows what temperatures can be expected on March 26, 2014, 12:00 UTC.
As above image illustrates, temperatures over a large part of North America can be expected to be hardly higher than temperatures over the Arctic Ocean mid next week. It is this very difference between high altitude temperatures and lower altitude temperatures that drives the Jet Stream. In the absence of much difference, changes to the Jet Stream changes are making it easier for cold air to move out of the Arctic and for warm air from lower latitudes to move in. The Polar Vortex is similarly affected, as illustrated by the image below.
At lower altitude, the highest wind speed detected on the image below was 94 km/h (green marker). Strong winds brought a lot of rain from the Atlantic Ocean to the U.K., as has been the case for some time.
 |
| [ click on image to enlarge ] |
 |
| [ Sea Surface Temperatures (SST) – click on image to enlarge ] |
Each of these feedbacks (extreme weather, methane release and albedo changes) can cause stronger temperature rises in this region than the rise resulting from carbon dioxide released in the atmosphere.
The interactive diagram below shows thirteen feedbacks that are accelerating warming in the Arctic, from the earlier post The Biggest Story of 2013.
 |
| Hover over each kind of warming and feedback to view more details, click to go to page with further background |
In conclusion, the situation is dire and calls for comprehensive and effective action, as described at the Climate Plan blog.


